2015, 2016, & 2017 User and Device Printing Statistics

This article by West McDonald was originally published here.
We’ve just compiled the 2017 User and Device Printer BI Dashboard and one thing’s for sure: Print behaviors are changing in dramatic ways compared to any previous year that we’ve studied. This is the 3rd year we’ve run the numbers and some trends are becoming clear. In this blog we’ll explore those trends and share what some of the most telling differences are between the 2017, 2016 and 2015 data sets.
Let’s begin by taking a closer look at details surrounding some key metrics for understanding print and user printing trends. Here are some of the key ones we’ll look at for all 3 years of data:
- Average job size
- Duplex vs. Simplex
- Color vs. Mono printing
- Color vs. Mono spend
- Average pages printed per user
- Color email and web printing
Average Job sizes:
- 3.69 pages per job in 2015
- 3.12 pages per job in 2016
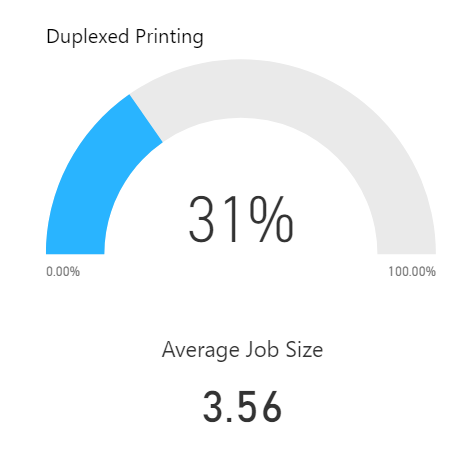
- 3.56 pages per job in 2017
If there is any surprise here it’s how little job sizes have changed over the 3 year period. The numbers tell us that there is still plenty of room for smaller network print devices in most offices.
Duplex vs. Simplex printing:
- 20% duplex in 2015
- 20% duplex in 2016
- 31% duplex in 2017
A market increase of 11% in duplex levels likely tells us that people are making better use of the functions and capabilities of their devices. This makes sense as most of the data comes from customers under MPS agreements and increasing duplex is one of the best ways to drive down printing costs. Each sheet of paper costs 6/10ths of a cent to 8/10ths of a cent per page and increasing duplex for non-customer facing printing can drive down total costs dramatically.
Color vs. Mono printing:
- 22% color vs. mono printing in 2015
- 19% color vs. mono printing in 2016
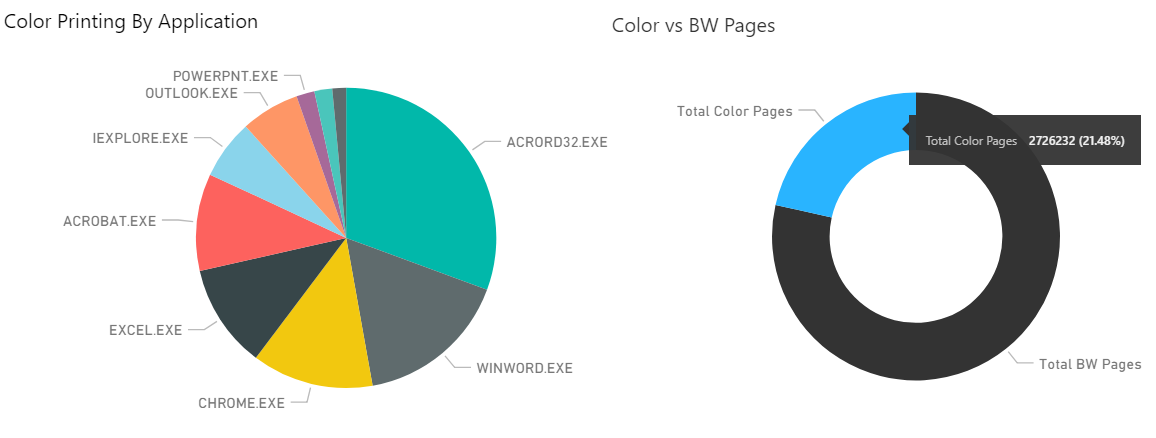
- 21% color vs. mono printing in 2017
Color volume levels have remained fairly static. This is surprising as many are saying that “inexpensive color” should be driving total color volumes upward. As with improved levels of duplex printing, static color volumes are likely due to good management and cost reduction efforts.
Color vs. Mono Spend:
- 42% total color spend in 2015
- 44% total color spend in 2016
- 10% total color spend in 2017
Lower color printing volumes and lower costs per page for color are driving a dramatic reduction in color revenues. There was an increase in color spend in 2016 from 2015 so this noteworthy drop is surprising.
Average pages per user:
- 3 pages per user for 2015
- 4 pages per day for 2016
- 3 pages per user per day for 2017
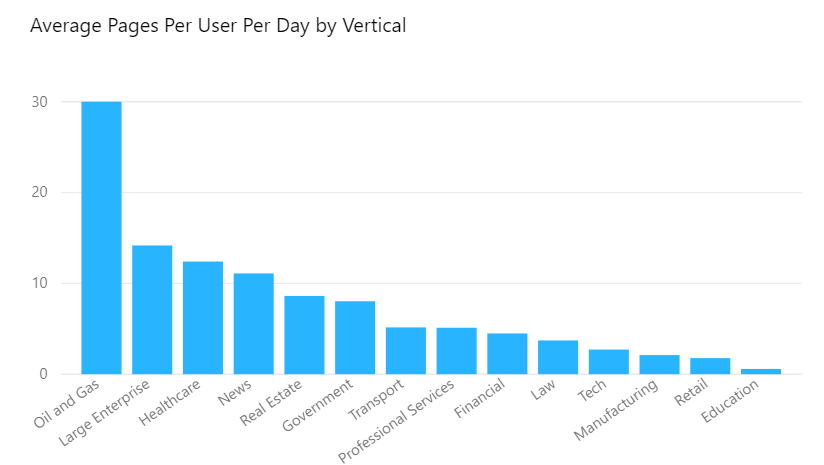
Volumes per user are down slightly from 2016. Digital workflows and document management are likely having a big impact on how people work. Fewer pages printed and more automated digital business processes are clearly taking root and not going away.
Color email and web printing:
- 20% color email/web printing in 2015
- 25% color email/web printing in 2016
- 18% color email/web printing in 2017
2017 saw a big reduction in the number of email and web pages printed in color. There is not enough detail for a trend as 2016 numbers were up from 2015.


