How a 257-page report was turned into a single dashboard

We are in the data science era, “be a leader, not a victim” IBM
“Once we show them the BI dashboard and the dashboarding process, the customer instantly engages and wants to find out more.”
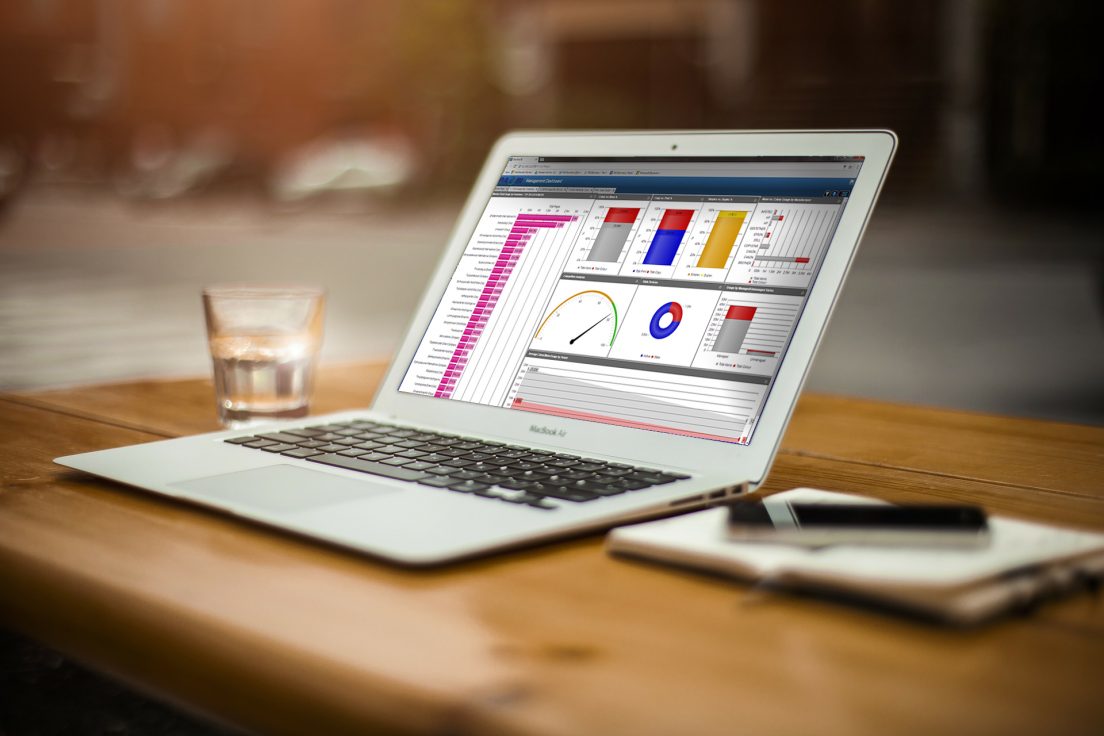
In our pre-BI days, I supplied Herculean reports of over 250 pages long. A comprehensive audit report of printers and users print behaviour. Very impressive, very heavy, a very long time to study and extract data from. Now, we can use our BI dashboard to present all the facts and data in a single visual. We can communicate the key facts to our customers. Just to name a few, from the dashboard the reader could investigate:
- Application printing
- The busiest users
- Splits for single and double sided printing
- Colour usage
- Who uses the devices and how much they are used
- Breakdown of costs
Make the service more Premiership than League 1
The information is presentable straight to the customer. They can have a login to review data throughout the engagement, yet you control the data as copies cannot be sent to your competitors. The dealer now has the chance to spot critical data quickly to re-connect with the customer; make suggestions, be proactive, give their customer the five-star experience.
A MPS dealer only needs to remember two letters; BI (Business Intelligence) to tap into one of the fastest growing industries of the digital transformation. Managed Print Services (MPS) is communicating data to a customer for decision making. Business Intelligence is a global industry and technology to serve that purpose for every aspect of workflow and decision making. We are using BI visualisations to evolve MPS and the dealer network that adopts the technology.
The field of BI is well developed and commonplace in other sectors. The largest firms around the world are investing into it to counteract falling margins and commodity prices to boost their efficiency and save billions of Dollars.
MPS has:
- Intensive reporting requirements
- Falling margins and increased competition
- Big data
- The need to identify operating efficiencies
- The need to save money and resources
- The need to reconnect with the customer
When we demonstrate a BI dashboarding process for a single source of data the concept is so intuitive the next question is always, “can we extend the technology to other parts of the business?” A big step up but if Leicester City can win the league at 5000 to 1 anything is possible.
Ready for a product demo? Contact us now.


